How Can Hem Brewing Improve Your Brewery Production Process?
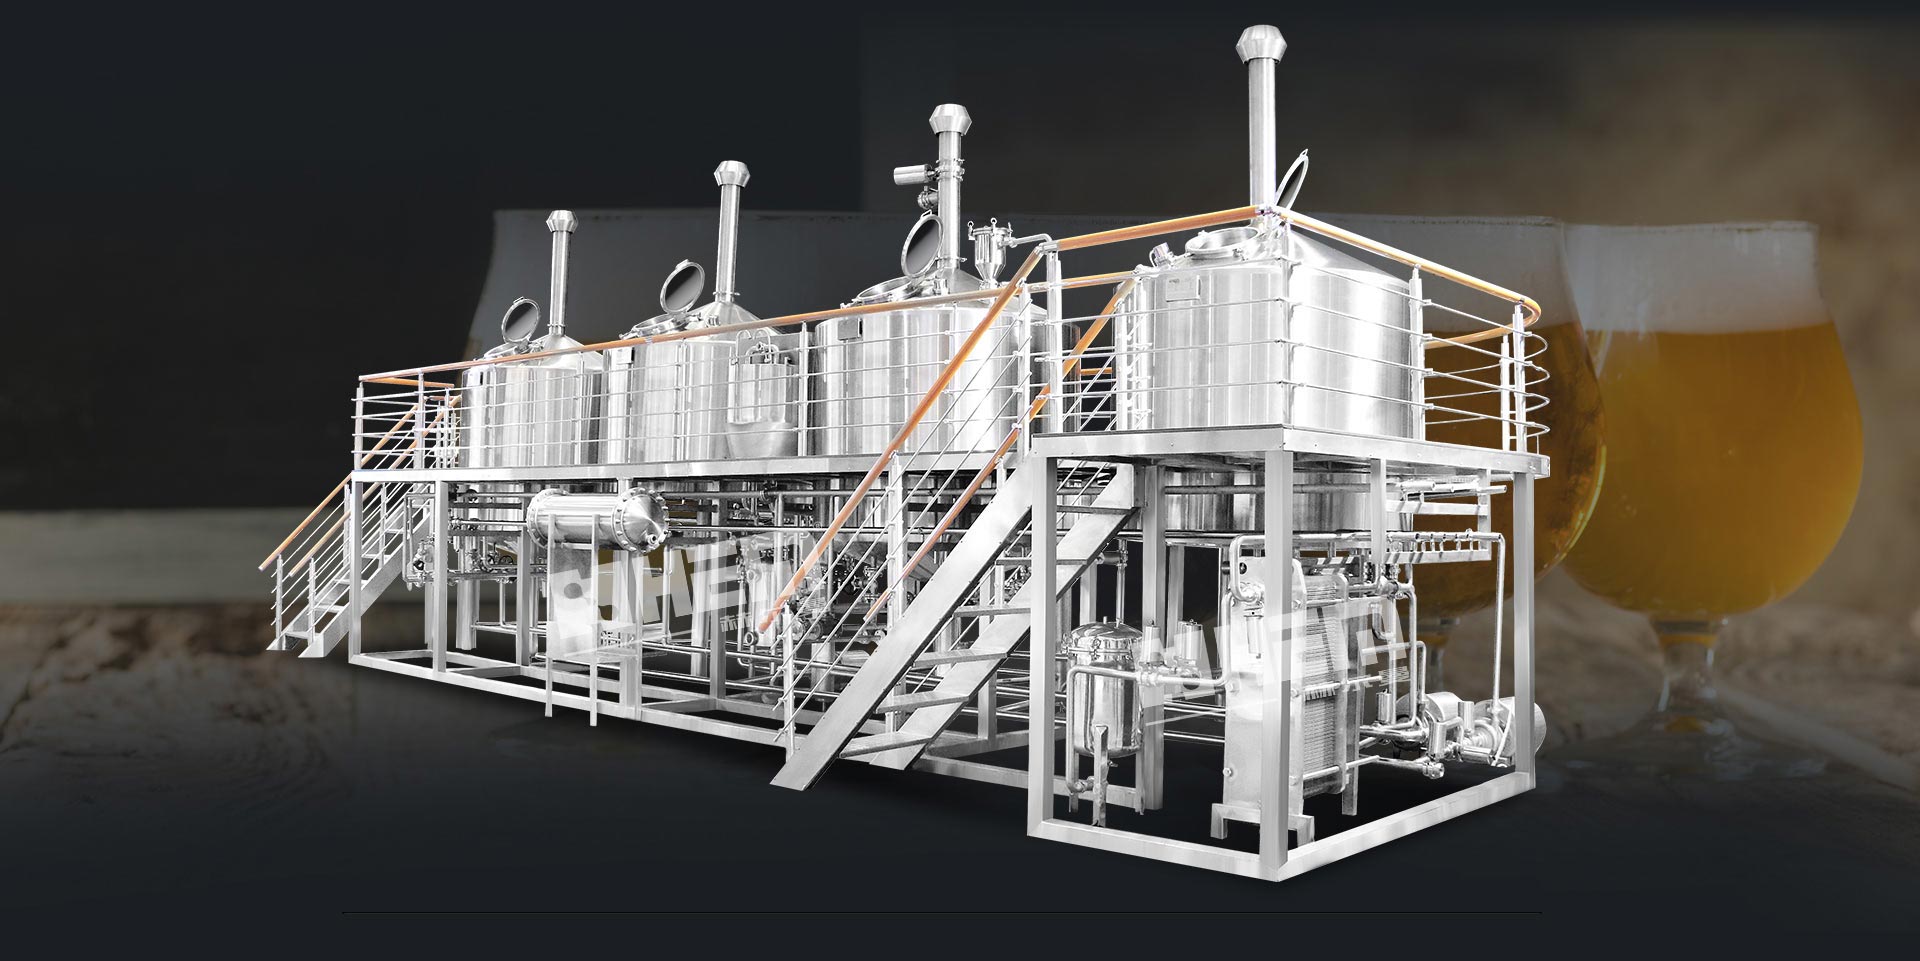
Hem Brewing can improve brewery production by matching brewhouse capacity, fermentation volume, cooling demand, cleaning routines, and packaging flow instead of treating each machine as a separate purchase. Commercial brewhouse yield commonly sits around 74–80%, while smaller breweries may operate closer to 65–70%, leaving measurable room for better milling, mashing, lautering, and wort recovery. Water provides another measurable target: the Brewers Association reports an average brewery water-use ratio near 7 barrels of water per barrel of beer, while efficient craft breweries can operate below 3:1. Equipment selection matters most when it improves the whole production flow rather than one vessel at a time.
A brewery producing 5,000 barrels per year does not have the same equipment needs as a 50,000-barrel operation. Tank quantity, brewhouse size, daily turns, fermentation time, cold-storage capacity, and packaging speed all determine how much beer can actually leave the facility. A larger brewhouse alone will not increase annual output when fermentation tanks are already full for 14–21 days.
Capacity planning should therefore start with finished beer and work backward. If a 20-barrel brewhouse produces two turns per day, five brewing days can create 200 barrels of wort per week. Ten 40-barrel fermenters provide 400 barrels of nominal fermentation capacity, so a 14-day tank cycle can already make cellar space the production limit.
That relationship makes equipment sizing more useful than simply comparing vessel prices. A supplier such as hem beer equipment can be evaluated by how well brewhouse vessels, fermentation tanks, glycol cooling, controls, piping, and cleaning equipment fit the brewery’s planned production rate. Oversized equipment raises capital and utility requirements; undersized equipment adds labor hours and extra production cycles.
Brewhouse performance is a good place to measure whether the equipment layout is working. MBAA material cites typical brewhouse yields around 74–80%, compared with roughly 65–70% for microbreweries, while an MBAA technical example published in 2019 calculated an 86% brewhouse efficiency. A brewery moving from 70% toward 80% recovery can obtain more usable extract from the same malt bill.
Milling, mash consistency, water chemistry, temperature, and lautering all affect that number. A mill should open the grain sufficiently for starch access without reducing the husk to material that slows filtration. During lautering, uneven grain beds can allow sparge water to pass through limited channels instead of washing extract evenly from the full bed.
MBAA guidance on extract recovery notes that a thicker mash, greater sparge-water allocation, finer crush, and mash-out temperatures around 176°F/80°C can improve wort recovery under suitable process conditions.
Better extraction should not be pursued by extending every brew day. A brewery gaining 2% more extract but adding 45 minutes to each batch may lose production capacity elsewhere. For a brewhouse making three batches per day, an additional 45 minutes per batch adds 2.25 hours to the operating schedule, so yield, labor, and vessel occupancy need to be measured together.
Temperature control becomes more important once wort reaches fermentation. American Homebrewers Association technical material gives common ale fermentation at about 61–72°F (16–22°C) and lager fermentation around 48–57°F (9–14°C), although strain requirements vary. Fermentation outside the intended range can alter ester, fusel alcohol, aroma, attenuation, and fermentation speed.
A properly sized glycol system therefore has to handle more than tank volume. It must account for wort pull-down, heat released during active fermentation, cold crashing, ambient conditions, piping losses, and the possibility that several tanks demand cooling at the same time. A system sized only for average demand can struggle when 3 or 4 fermenters enter high-demand stages together.
| Production point | Useful measurement | What equipment should control |
|---|---|---|
| Mash | Temperature, pH, extract | Heating, agitation, vessel geometry |
| Lauter | Runoff rate, extract recovery | Grain bed, screens, flow control |
| Wort cooling | Knockout temperature | Heat exchanger and cold-water flow |
| Fermentation | Temperature and gravity | Glycol system and tank controls |
| Packaging | Dissolved oxygen, fill consistency | Filler, purge and transfer system |
| Cleaning | Water, chemical use, cycle time | CIP equipment and spray coverage |
Fermentation performance also depends on oxygen before yeast begins its main work. Brewing guidance commonly places dissolved oxygen for average wort and normal pitching rates around 8–10 ppm, with high-gravity wort potentially requiring more. Measurement gives the brewer a repeatable target instead of relying on aeration time alone.
After fermentation, oxygen changes from a useful process input to something brewers generally try to limit. The Brewers Association notes that preventing oxygen pickup from the end of fermentation is important for packaged beer quality. Tank transfers, hoses, bright beer tanks, pumps, fillers, and poorly purged packages can all add oxygen after the beer has completed fermentation.
That makes piping and transfer design part of product quality. Shorter sanitary transfer paths reduce unnecessary hose connections, while properly selected pumps can move beer without excessive agitation. In a brewery performing 20 transfers per week, removing only 10 minutes of setup and sanitation from each transfer saves more than 3 hours of production labor every week.
Water use deserves the same level of measurement because brewing uses water in the brewhouse, cellar, packaging area, cleaning systems, and utilities. The Brewers Association has reported an industry average near 7 barrels of water for every barrel of beer, while some efficient craft breweries operate below 3 barrels per barrel. A brewery producing 10,000 barrels annually would use 70,000 barrels of water at 7:1 versus less than 30,000 at 3:1.
A separate industry dataset covering 211 breweries reported water-use ratios ranging from 3.26 to 7.44 L/L in 2010, with a 10% improvement shown across the benchmark period. The large range explains why flow meters are useful at individual production areas rather than only at the building’s main water connection.
Cleaning is one place where measurement can reduce consumption without reducing sanitation standards. CIP systems can control cleaning temperature, circulation time, chemical concentration, and rinse duration. A fixed 20-minute rinse that is actually clean after 14 minutes uses 30% of that rinse period unnecessarily; conductivity or validated operating procedures can provide a more consistent endpoint.
Cleaning design also affects labor. A brewery with eight fermentation vessels that spends 25 extra minutes manually preparing and moving cleaning connections uses more than 3.3 additional labor hours for one complete tank-cleaning cycle. Permanent or well-organized CIP connections can reduce repeated setup while keeping cleaning procedures consistent between operators.
Energy follows many of the same process steps as water. Brewing requires thermal energy for mash heating and wort boiling, then cooling capacity for wort chilling, fermentation, maturation, and cold storage. A 2022 MBAA Technical Quarterly analysis of alcohol-free beer processes illustrates the scale of thermal demand: its 100,000-hL model included hundreds of thousands of megajoules at individual heating and cooling stages.
Heat exchangers can recover part of the energy that would otherwise leave the process. Hot wort may transfer heat to brewing water while being cooled toward fermentation temperature. The warmed water can then be stored for a later brewing or cleaning step, reducing the amount of new heating required during the next production cycle.
Production scheduling determines whether that recovered heat can actually be used. The Brewers Association’s 2015 benchmarking report described Yards Brewing Company brewing continuously for 3–5 days, allowing more efficient use of heating, cooling equipment, and water. Equipment layout and production scheduling therefore need to be planned together rather than reviewed as separate operating issues.
Packaging needs similar balance. A canning line rated at 40 cans per minute can theoretically process 2,400 cans per hour, but real output falls when operators stop for foam problems, low product supply, lid issues, cleaning, or label changes. At 85% operating availability, the same nominal line provides about 2,040 cans per hour before other losses are considered.
The tank feeding that line must also supply beer at suitable pressure and temperature. If packaging repeatedly stops because the bright tank, chiller, air supply, or CO₂ system cannot maintain the required conditions, buying a faster filler does little for weekly packaged volume. Production records should compare rated speed with actual saleable packages per hour.
Automation can help where measurements are repeated frequently. Temperature probes, pressure transmitters, flow meters, level sensors, automated valves, and recipe controls can record conditions at fixed intervals. If a brewery makes 500 batches per year, recording mash temperature, knockout temperature, fermentation profile, gravity, and cleaning records for every batch creates a much stronger operating history than relying on handwritten notes from a small sample.
Automation should still leave operators able to verify the process. A temperature sensor reading 68°F is only useful when it is calibrated and installed in a location that represents the liquid accurately. A 2°F measurement error is about 3% of a 68°F reading on the Fahrenheit scale, yet the process effect can be noticeable for temperature-sensitive yeast strains.
Maintenance deserves the same attention because production capacity depends on equipment being available when scheduled. Pumps, valves, heat-exchanger plates, gaskets, pressure-relief devices, refrigeration components, and instruments all have service requirements. Losing one 40-barrel fermentation tank for 14 days removes 40 barrels of active tank capacity during that period, regardless of how fast the brewhouse can produce wort.
A brewery considering new equipment can therefore compare proposals using measurable operating targets rather than tank volume alone: expected brewhouse efficiency, water-to-beer ratio, batches per day, fermentation capacity, cooling demand, CIP time, packaging output, oxygen control, and planned annual barrels. Brewers Association benchmarking resources specifically encourage breweries to track water, wastewater, energy use, solid waste, and greenhouse-gas performance over time.
For a brewery growing from 5,000 to 10,000 barrels per year, a 100% sales-volume increase does not automatically require every production asset to double. Adding larger fermenters, improving brewhouse turns, reducing cleaning time, increasing cold-side capacity, or removing packaging stoppages may provide part of the required output with existing equipment.
The useful purchasing question is therefore measurable: how many saleable barrels can the brewery produce per week with the proposed brewhouse, cellar, utilities, cleaning system, and packaging line operating together? Comparing that figure with water use, labor hours, extract recovery, energy demand, and packaged-beer quality gives a practical basis for selecting equipment that can support the brewery for several production years rather than only the next expansion.